GPS sensors give women’s soccer team analytic edge
Kim Stagg ’17 endured a rigorous workout in the women’s soccer season finale last November.
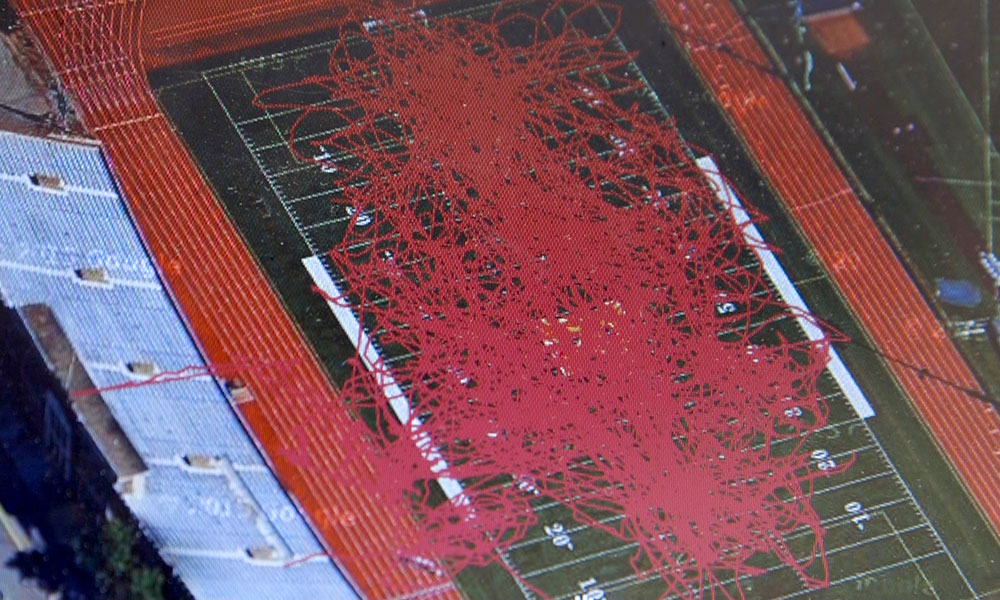
The midfielder from Winter Springs, Florida ran 10.05 miles, burned 2,006 calories, and completed 63 sprints in a 2-2 tie with Emory University. She ran at an average speed of 3.2 miles per hour. And she left cleat marks over 90 percent of Fauver Stadium.

Kim Stagg ’17 on the field during the Flower City Classic. (University photo / Athletics Communications)
“She was everywhere,” Yellowjackets coach Thomas (Sike) Dardaganis says.
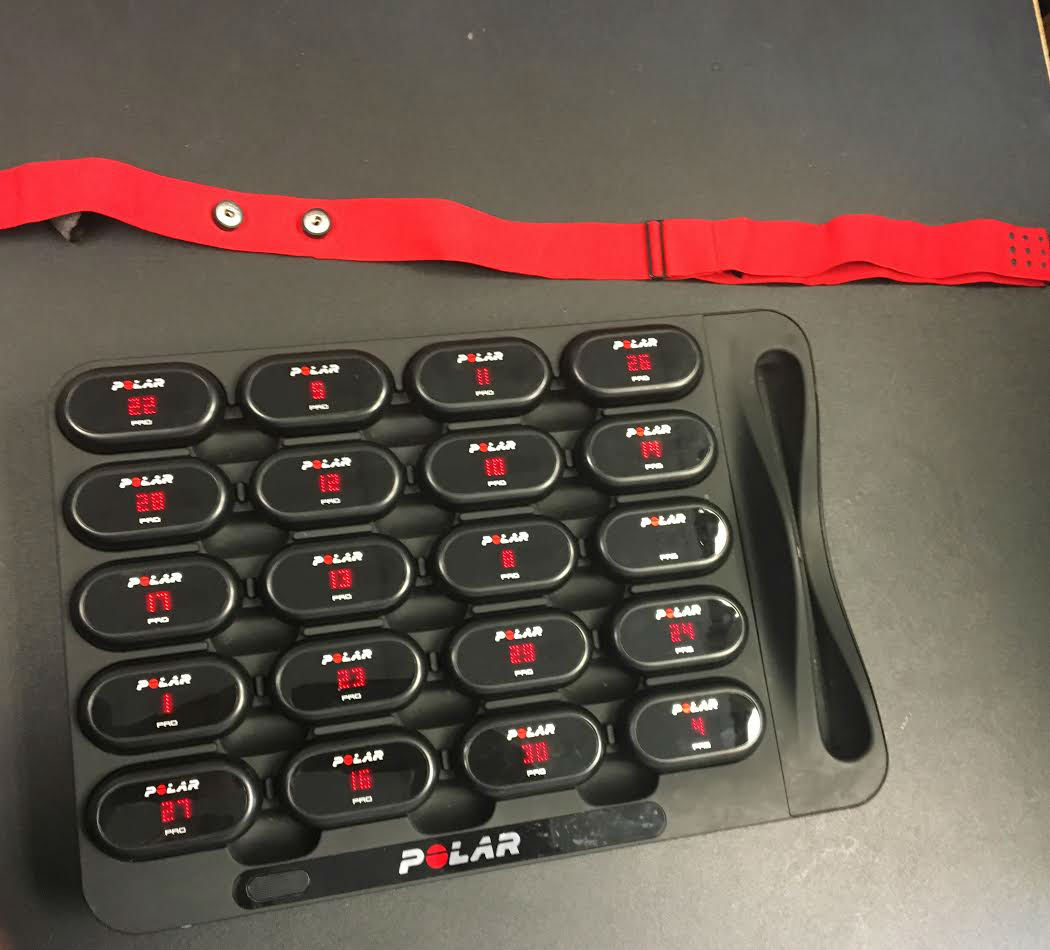
Dardaganis knows this because he has the heat map and data to prove it. His program was one of the first in the nation (and remains the only one at Rochester) to use Polar Team Pro, a GPS-based performance tracking system for team sports. Each player straps a sensor under her jersey, close to her heart. The sensor tracks movement, monitors heart rate, and acts as an accelerometer, tracking how many times an athlete runs at full speed.
Unlocking big data
A Newscenter series on how Rochester is using data science to change how we research, how we learn, and how we understand our world. The information is logged in an iPad carried by a team manager during practices and games. Once the iPad is loaded onto a docking station, the sensors start charging, and the data for each player is uploaded for review.
“From an analytic standpoint, it’s fantastic,” says Dardaganis, in his sixth year as head coach after serving 14 as a assistant coach for the team.
Dardaganis didn’t need data to realize Stagg was a force against Emory—“I could have known that just by watching,” he says. But the analytics are the ultimate fact-checker.

This heat map shows just how much ground Kim Stagg ’17 covered in the Fauver Stadium season finale last November. (University photo / Matt Mann)
“Often, players ask, ‘How can I get more playing time?’ It’s valuable to use the data as a reference point, like noting, ‘if you increase your sprints per game, you’ll be more effective since our game is now more than ever about being explosive.”
When Rochester signed on with Polar two years ago, Polar sent a specialist to measure Fauver Stadium’s dimensions and create a GPS map tailored to that field. The rewards were immediate.
“We had lost a few players to [knee] injuries, and our practices weren’t matching our games in terms of intensity,” Dardaganis says. “Maybe we were being cautious. Polar looked at our data and said, ‘Coach, we know you’re worried about injuries, but one of the practice days was not matching the game-day exertion. If it doesn’t, then the game is completely foreign to the athletes.’ So I said, ‘Great. We need one practice a week that matches the data we see on game day.’”

Each University women’s soccer player receives a GPS sensor with their corresponding jersey number. (University photo / Jim Mandelaro)
During preseason drills, Dardaganis and his staff measure each player’s resting and maximum heart rate. If a player exceeds the maximum during a game, it’s time to give that player a rest.
Stagg, a public health major, says using data from Polar “made me realize how much running I actually did in a game, and why I would be so tired after games.”
In-game fatigue can be dangerous.
“Studies show you’re most susceptible to an injury when you’re tired,” Dardaganis says. “Our team manager is tracking everything on the iPad during the game, and it shows then a player is fatigued because their space on the iPad turns red.”
The heart rate monitor and accelerometer consist of five zones, from resting to full speed. Playing it straight down the middle isn’t always a good thing.
“Our first year with Polar, we noticed many of our players were in Zone 3,” he says. “We thought, ‘That’s good. They’re moving around.’ But Polar said, ‘Watch out for your midfielders who are spending so much time in Zone 3. They’re just jogging.’”
That’s where the data proved so valuable, Dardaganis says.
“If you’re always in Zone 3, you’re never going to lose your defender,” Dardaganis says, “because she can stay with you in a jog.”
When it comes to using data, no one can say Rochester’s women’s soccer team is being left behind.
“Athletes don’t always communicate with coaches when they’re sick or injured,” Dardaganis says. “Having the data right there? Well, that’s a great conversation starter.”
Data analytics is the new normal for college teams.
—Jim Mandelaro, February 2017


